AI tools for data visualization
Related Jobs:
Related Tools:
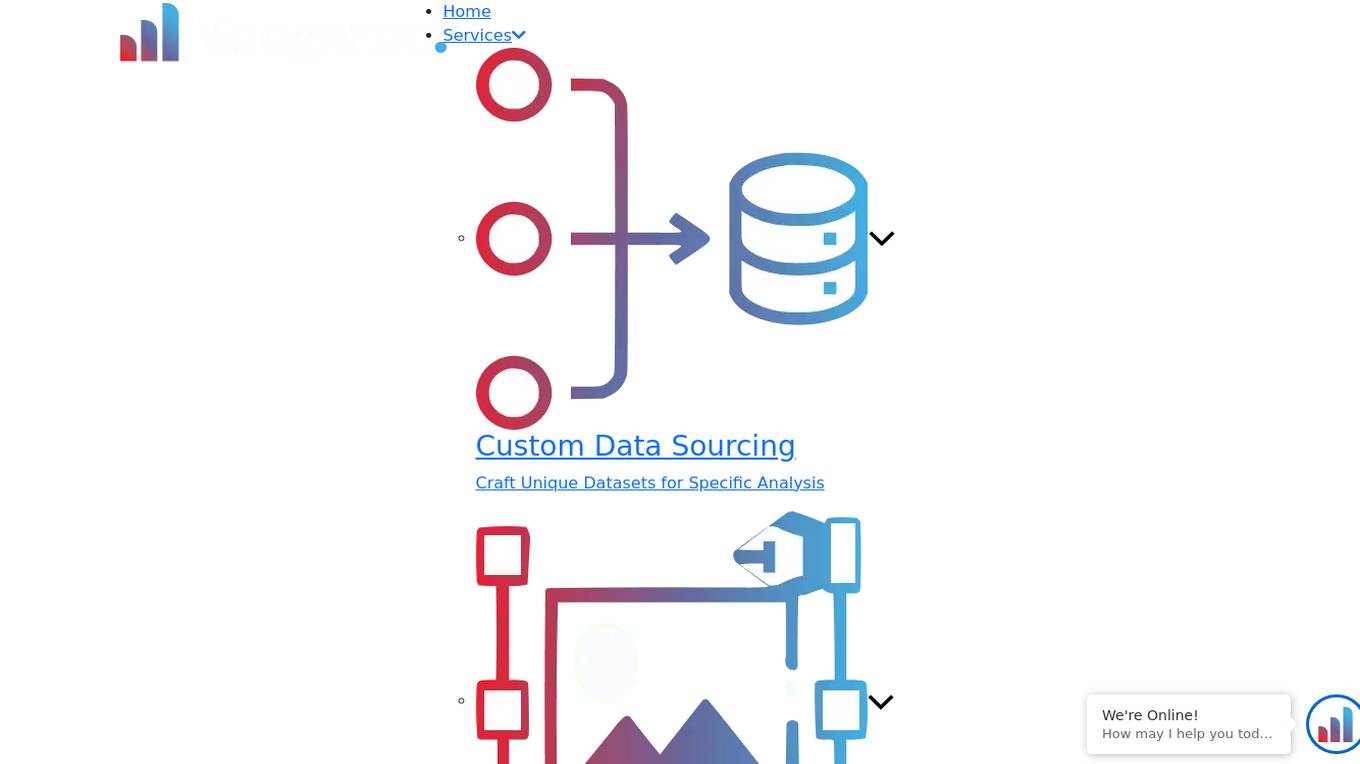
dataset.macgence
dataset.macgence is an AI-powered data analysis tool that helps users extract valuable insights from their datasets. It offers a user-friendly interface for uploading, cleaning, and analyzing data, making it suitable for both beginners and experienced data analysts. With advanced algorithms and visualization capabilities, dataset.macgence enables users to uncover patterns, trends, and correlations in their data, leading to informed decision-making. Whether you're a business professional, researcher, or student, dataset.macgence can streamline your data analysis process and enhance your data-driven strategies.
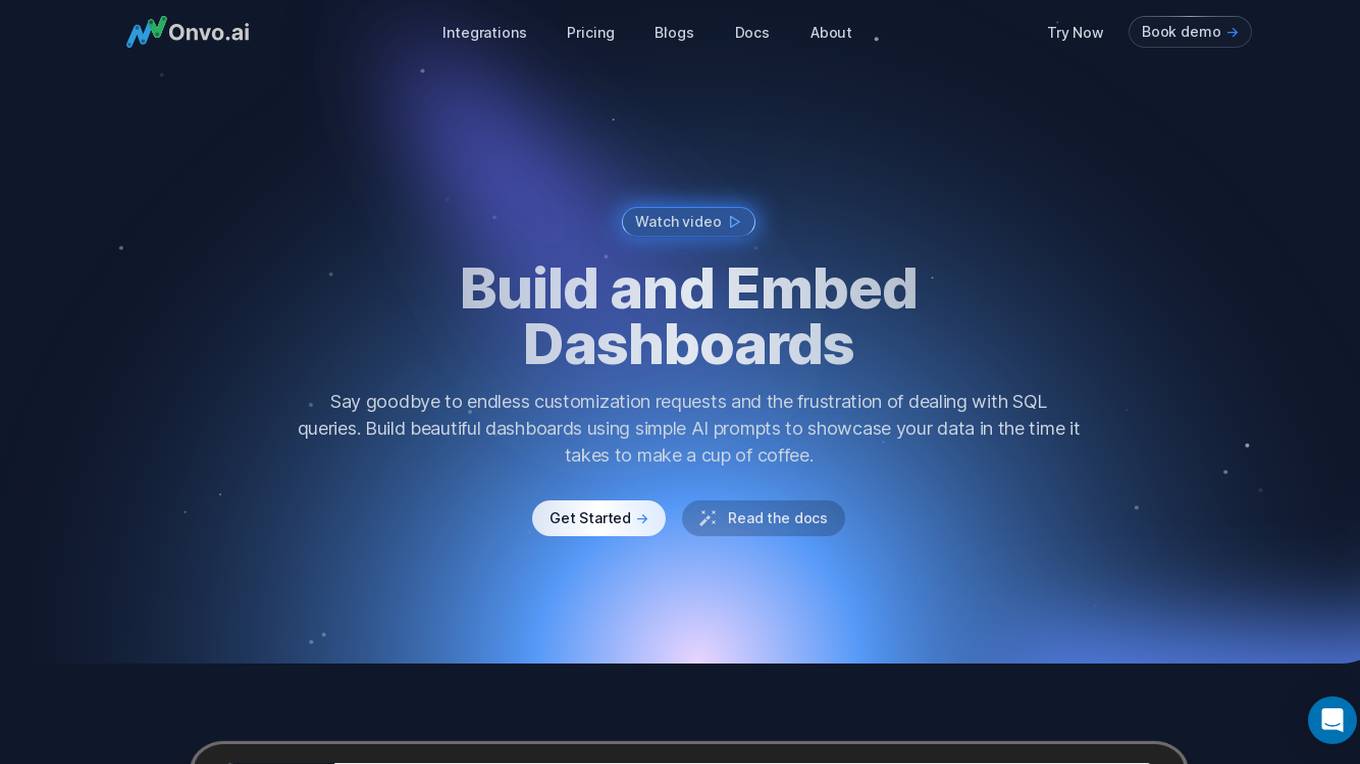
Onvo AI
Onvo AI is an embedded data visualization platform that allows users to create interactive dashboards and data visualizations using simple AI prompts. It connects to various data sources, enabling users to build insightful charts and visualizations without the need for complex queries or manual data manipulation. Onvo AI offers customization options, allowing users to match their brand's identity and provides secure sharing and embedding features. It also includes analytics capabilities, enabling users to track dashboard usage and user engagement.
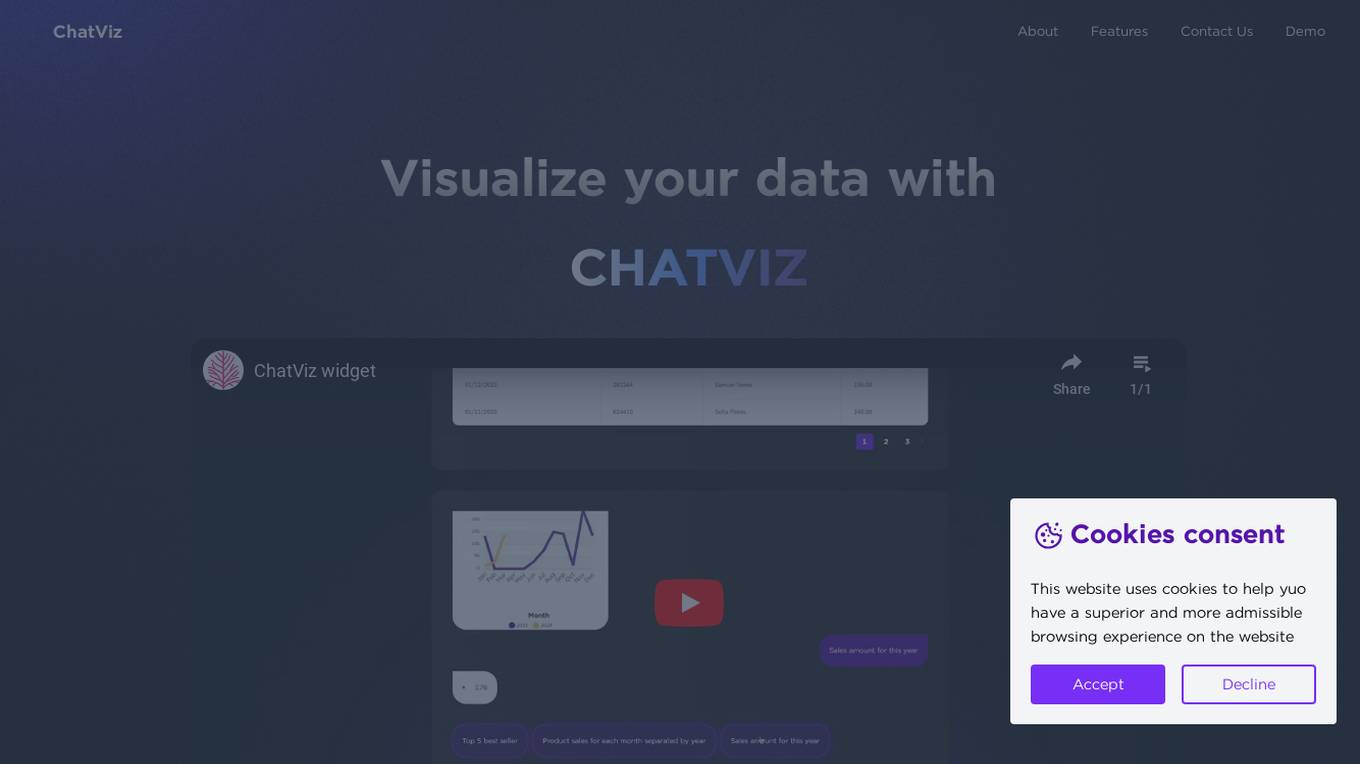
ChatViz
ChatViz is an AI-powered data visualization tool that leverages ChatGPT to enhance data visualization capabilities. It offers features such as SQL translator and chart suggestion to streamline the visualization process. By utilizing ChatViz, users can optimize development time, simplify data visualization, and say goodbye to dashboard complexity. The tool provides a new way to visualize data, reducing development time and improving user experience.
ChartPixel
ChartPixel is an AI-assisted data analysis platform that empowers users to effortlessly generate charts, insights, and actionable statistics in just 30 seconds. The platform is designed to demystify data and analysis, making it accessible to users of all skill levels. ChartPixel combines the power of AI with domain expertise to provide secure and reliable output, ensuring trustworthy results without compromising data privacy. With user-friendly features and educational tools, ChartPixel helps users clean, wrangle, visualize, and present data with ease, catering to both beginners and professionals.
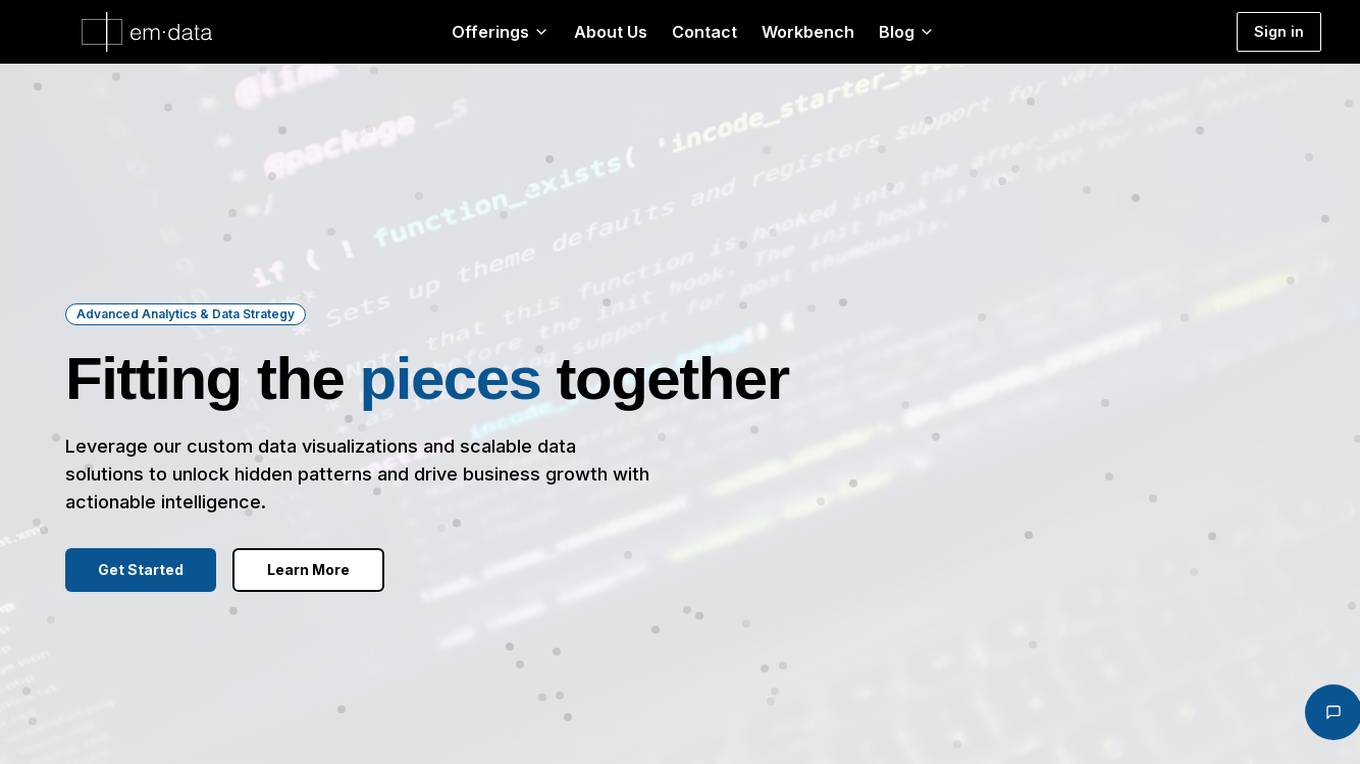
emdata.ai
emdata.ai is an advanced analytics and data strategy platform that offers a comprehensive portfolio of tools for leveraging data to drive business growth. The platform provides custom data visualizations, scalable data solutions, and AI-driven classification to uncover hidden patterns and insights. With features like deep financial analysis, competitive intelligence analysis, real-time data processing, and predictive analytics, emdata.ai empowers users to make informed decisions and optimize their operations. The platform also offers customized training programs to enhance users' data skills and knowledge.
Columns
Columns is an AI tool that automates data storytelling. It enables users to create compelling narratives and visualizations from their data without the need for manual intervention. With Columns, users can easily transform raw data into engaging stories, making data analysis more accessible and impactful. The tool leverages advanced algorithms to analyze data sets, identify patterns, and generate insights that can be presented in a visually appealing format. Columns streamlines the process of data storytelling, saving users time and effort while enhancing the effectiveness of their data-driven communication.
Infogram
Infogram is an AI-powered platform that enables users to create interactive data visualizations, infographics, reports, maps, charts, tables, slides, and dashboards effortlessly. With a wide range of features such as AI chart recommendations, interactive content, embeds, custom maps, data import, and advanced editing tools, Infogram empowers users to craft compelling visual stories. The platform also offers content engagement analytics, real-time collaboration, and a brand kit for consistent branding. Trusted by over 10 million users worldwide, Infogram is a go-to tool for individuals, teams, and organizations looking to transform data into engaging visuals.
ChartFast
ChartFast is an AI Data Analyzer tool that automates data visualization and analysis tasks, powered by GPT-4 technology. It allows users to generate precise and sleek graphs in seconds, process vast amounts of data, and provide interactive data queries and quick exports. With features like specialized internal libraries for complex graph generation, customizable visualization code, and instant data export, ChartFast aims to streamline data work and enhance data analysis efficiency.
SheetBot AI
SheetBot AI is an AI data analyst tool that enables users to analyze data quickly without the need for coding. It automates repetitive and time-consuming data tasks, making data visualization and analysis more efficient. With SheetBot AI, users can generate accurate and visually appealing graphs in seconds, streamlining the data analysis process.
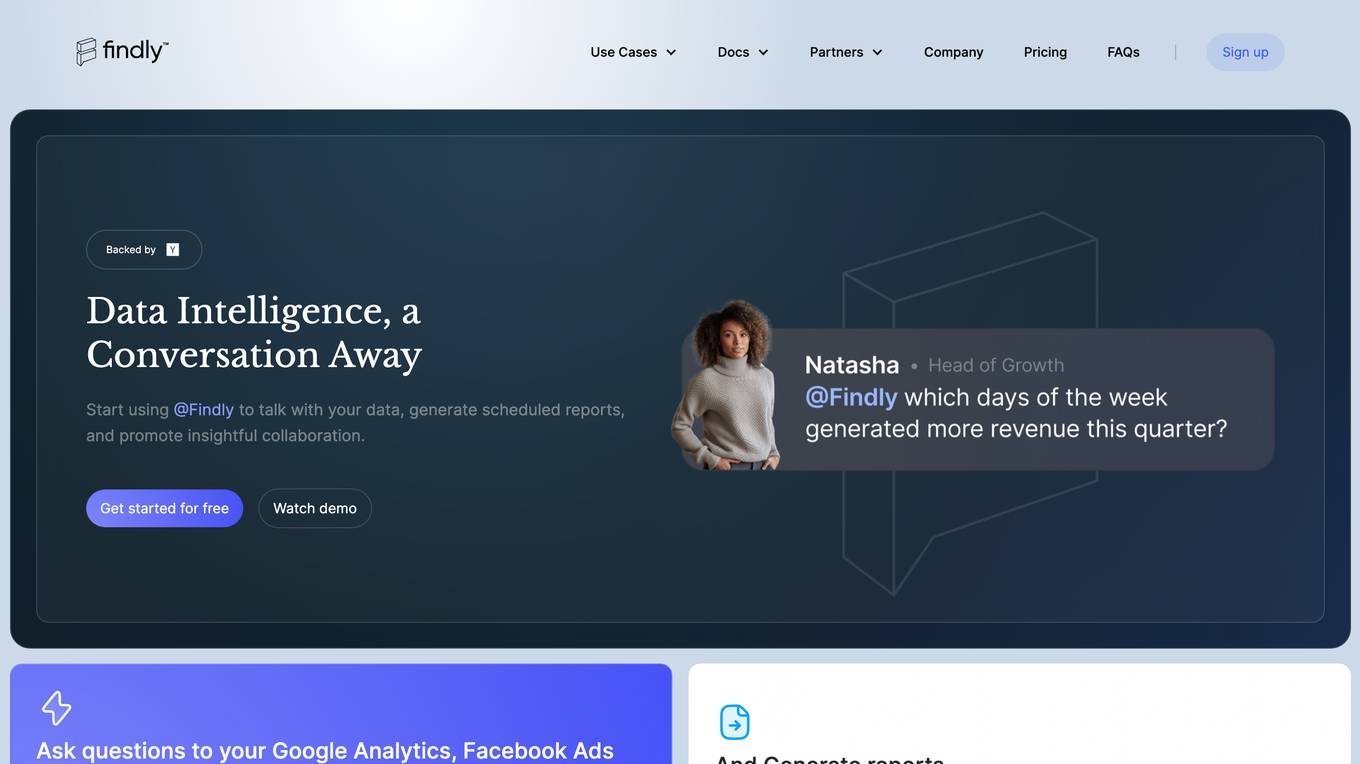
Findly
Findly is a data analytics platform that allows users to ask questions about their data and receive insights and reports. It integrates with various data sources such as Google Analytics, Facebook Ads, and BigQuery, and provides features such as data visualization, scheduled reporting, and templates. Findly is designed to make data analysis accessible and actionable for everyone on a team, regardless of their technical expertise.
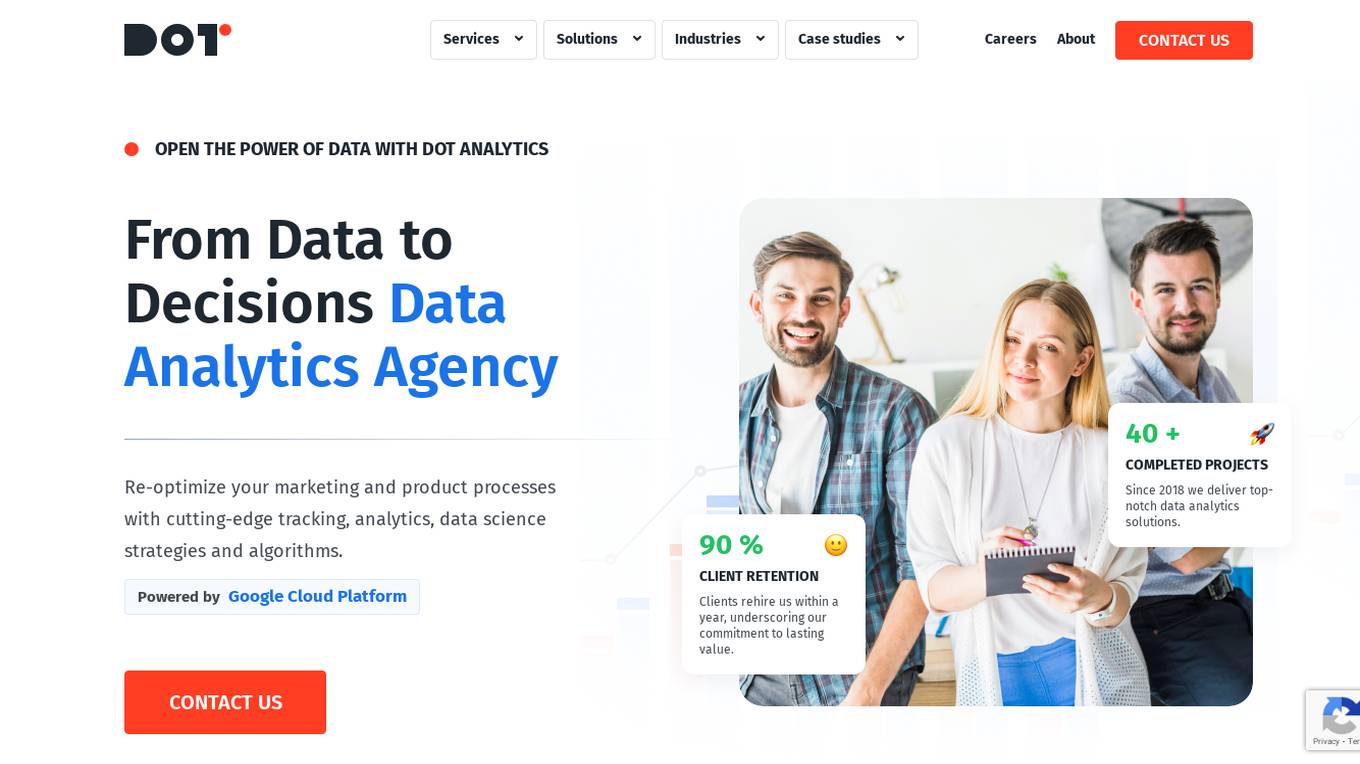
Dot Analytics
Dot Analytics is a growth-focused data analytics agency that offers a wide range of services including data analytics, data engineering, data visualization, data science, big data analytics, AI consulting, and more. They specialize in providing analytics solutions for data-driven business managers seeking accuracy, statistics, and data to drive revenue growth. With over 6 years of experience, they offer tailored analytics solutions to optimize customer acquisition cost, lifetime value, average order value, and conversions. Dot Analytics partners with clients from various industries to provide transparent, maintenance, and optimization services.
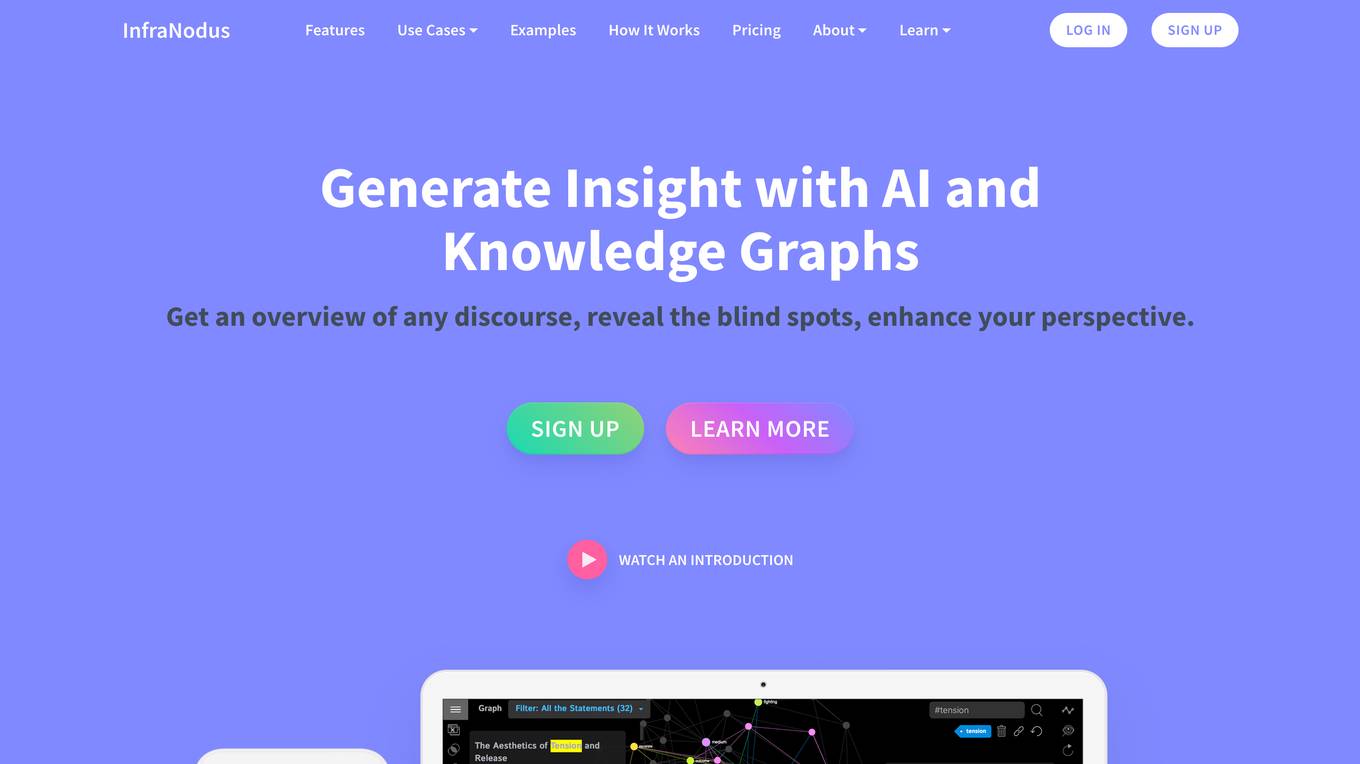
InfraNodus
InfraNodus is a text network visualization tool that helps users generate insights from any discourse by representing it as a network. It uses AI-powered algorithms to identify structural gaps in the text and suggest ways to bridge them. InfraNodus can be used for a variety of purposes, including research, creative writing, marketing, and SEO.
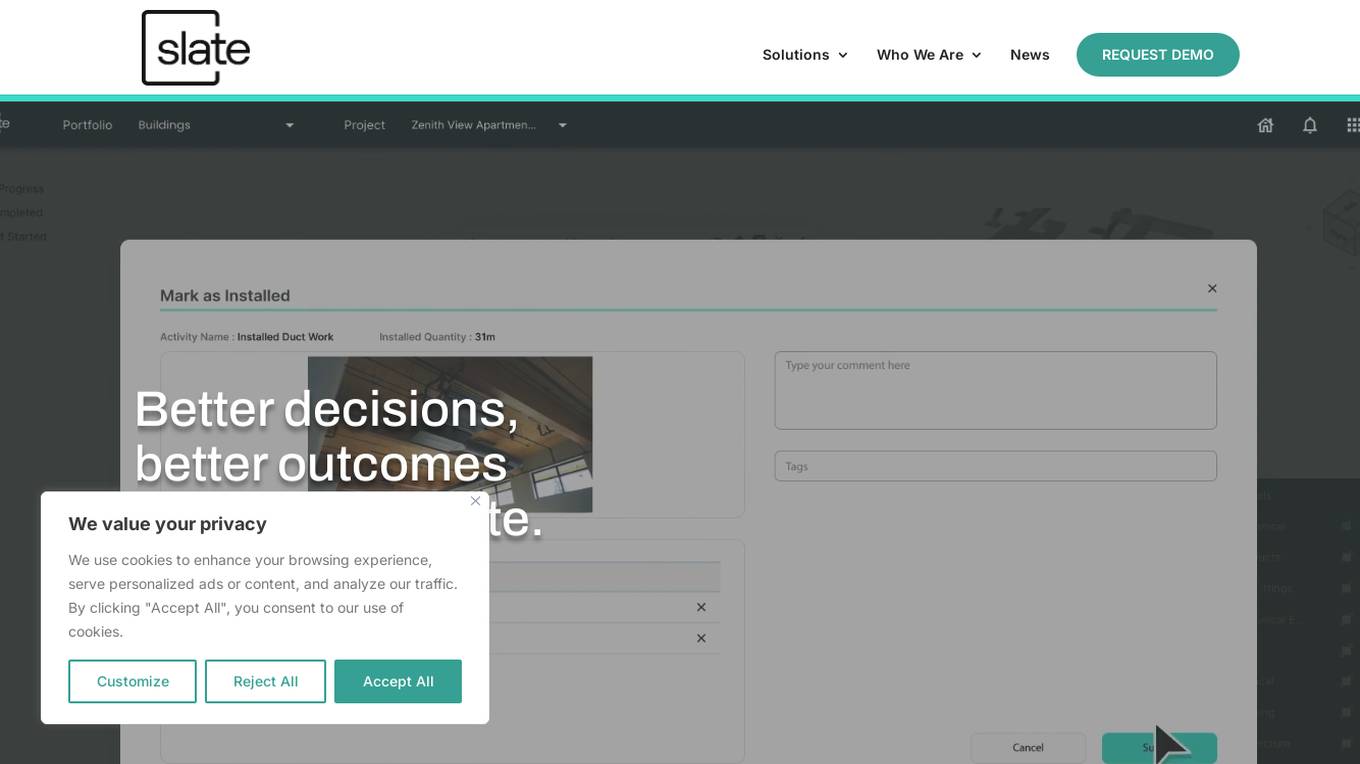
Slate Technologies Solutions
Slate Technologies Solutions is an AI-powered data analytics software that leverages predictive AI, generative AI, and conversational AI to provide a powerful toolkit for next-generation construction. The software connects, contextualizes, and enhances relevant information within existing data sources, allowing users to query, interact, and make decisions based on data insights and recommendations. Slate aims to address real-world construction problems by empowering teams with AI-driven intelligence, optimizing data, and turning unstructured information into actionable insights. The application improves operational efficiency, provides real-time progress reporting, and enables teams to make smarter decisions, ultimately driving profitability and success in construction projects.
OSS Insight
OSS Insight is an AI tool that provides deep insight into developers and repositories on GitHub, offering information about stars, pull requests, issues, pushes, comments, and reviews. It utilizes artificial intelligence to analyze data and provide valuable insights to users. The tool ranks repositories, tracks trending repositories, and offers real-time information about GitHub events. Additionally, it offers features like data exploration, collections, live blog, API integration, and widgets.
Compact Data Science
Compact Data Science is a data science platform that provides a comprehensive set of tools and resources for data scientists and analysts. The platform includes a variety of features such as data preparation, data visualization, machine learning, and predictive analytics. Compact Data Science is designed to be easy to use and accessible to users of all skill levels.
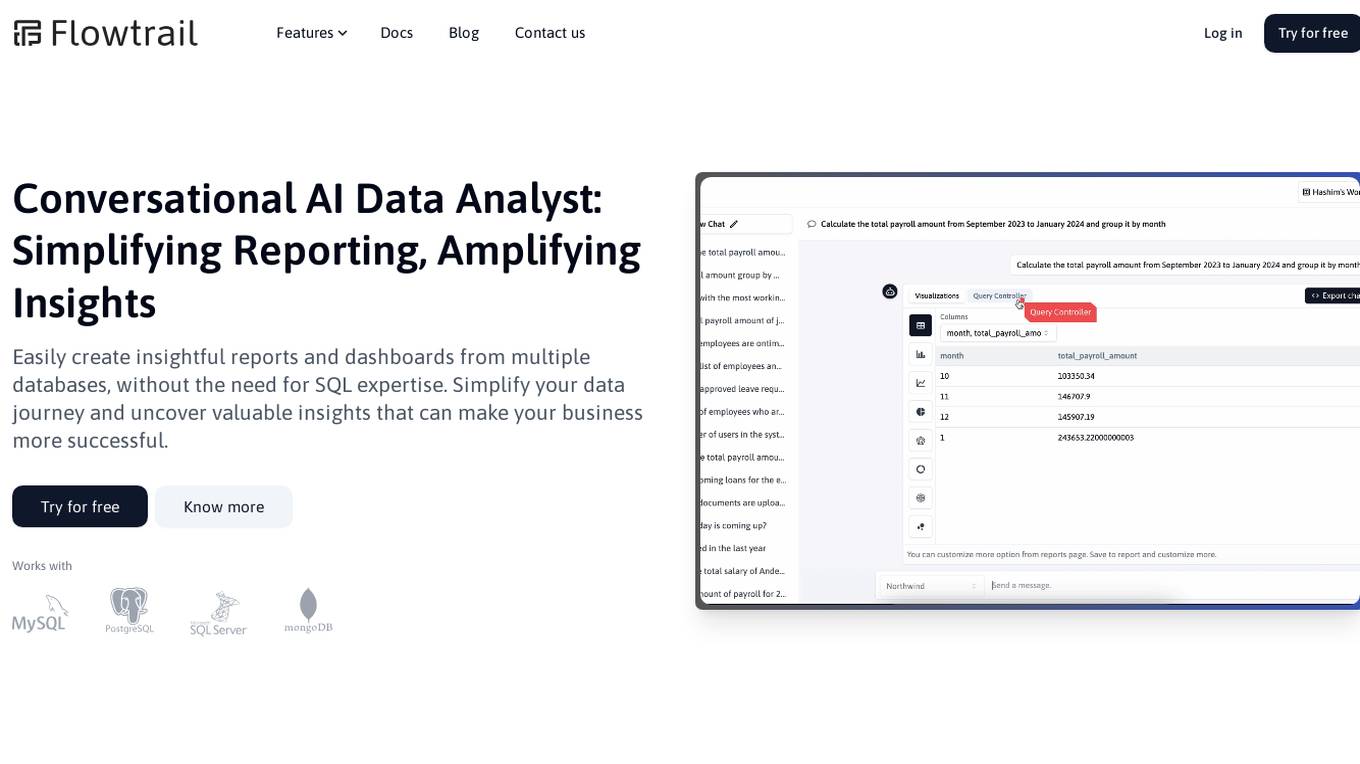
Flowtrail AI
Flowtrail AI is a powerful data analytics platform that simplifies reporting and amplifies insights for businesses. It allows users to effortlessly create insightful reports and dashboards from multiple databases without the need for SQL expertise. With features like AI-driven query building, natural language processing, and text-to-SQL conversion, Flowtrail AI transforms data into actionable insights, making data-driven decision-making more efficient and effective.
ExcelDashboard Ai
ExcelDashboard Ai is an AI tool that allows users to instantly convert Excel data into interactive dashboards. The tool simplifies the process of creating visually appealing and insightful dashboards without the need for complex coding or design skills. Users can easily upload their Excel files, customize the dashboard layout, and visualize data in a user-friendly format. ExcelDashboard Ai streamlines the dashboard creation process, saving time and effort for individuals and businesses looking to present data in a more engaging way.
Breadcrumb.ai
Breadcrumb.ai is an AI data analytics platform that enables users to combine, analyze, and chat with their files using AI data analytic agents. The platform is designed to be intuitive, eliminating the need for coding or data expertise. Breadcrumb's AI agents integrate and clean data, allowing users to ask questions in plain language and generate dashboards effortlessly. The tool provides a visual analytic canvas for exploring data, facilitating communication and collaboration across teams in real-time. With Breadcrumb, users can streamline operations, accelerate sales, and drive marketing decisions with evidence-based insights.
Powerdrill
Powerdrill is a platform that provides swift insights from knowledge and data. It offers a range of features such as discovering datasets, creating BI dashboards, accessing various apps, resources, blogs, documentation, and changelogs. The platform is available in English and fosters a community through its affiliate program. Users can sign up for a basic plan to start utilizing the tools and services offered by Powerdrill.
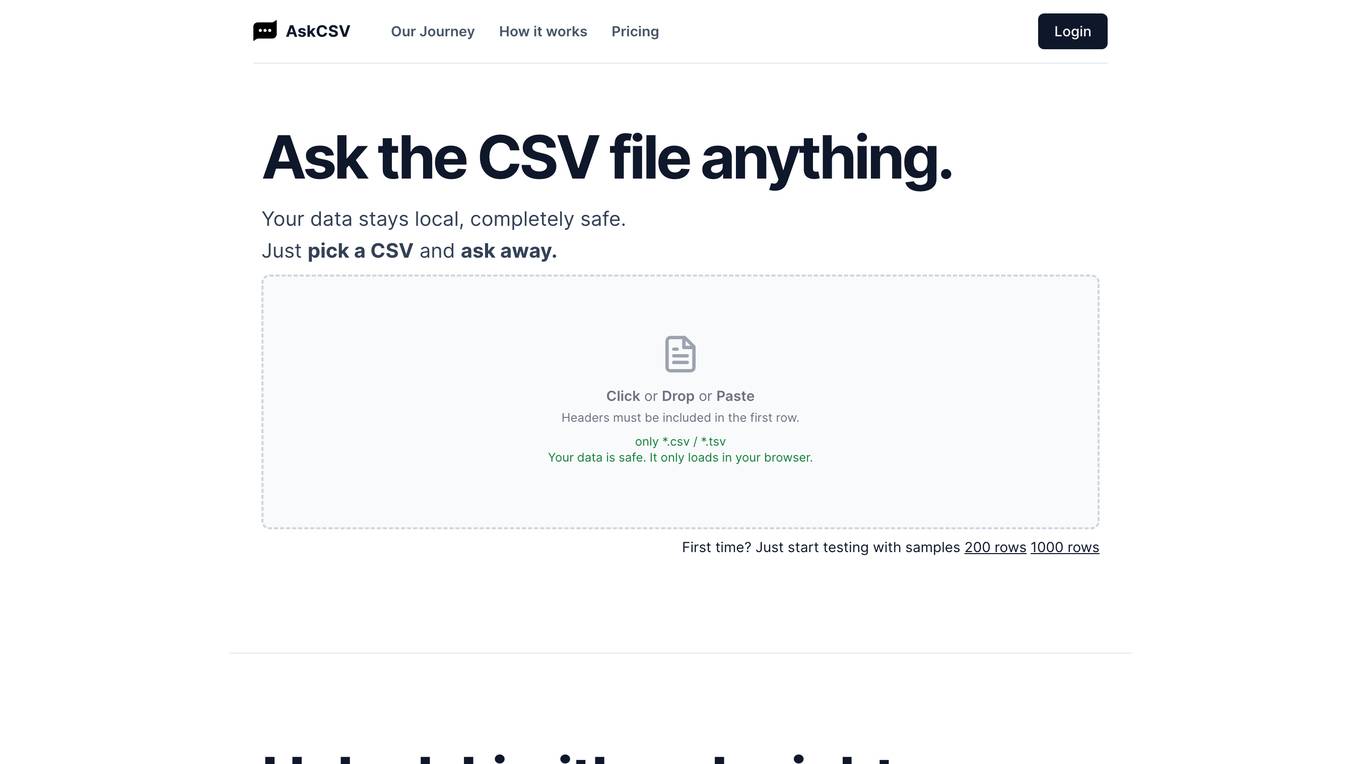
AskCSV
AskCSV is a revolutionary AI-powered tool that empowers you to unlock valuable insights from your CSV files. Simply ask any question about your data, and AskCSV will provide you with instant, accurate answers and visualizations. Your data remains completely secure, processed directly in your browser's memory without any server uploads. With AskCSV, you can effortlessly analyze your data, identify trends, make informed decisions, and gain a deeper understanding of your business.
Emmi Data Analysis and Visualizer
Expert in data analysis and visualization, offering clear explanations and guidance.
Illuminous - The Data Exploration AI
Expert in data analysis, visualizations, and predictions.
Vicky Vega
Generates Vega-Lite JSON code for Power BI visuals from data and descriptions.
Plotter
Provide a hand-drawing or screenshot of your desired plot along with the data and I'll make the plot.
Sheets Expert
Master the art of Google Sheets with an assistant who can do everything from answer questions about basic features, explain functions in an eloquent and succinct manner, simplify the most complex formulas into easy steps, and help you identify techniques to effectively visualize your data.
Time Tracker Visualizer (See Stats from Toggl)
I turn Toggl data into insightful visuals. Get your data from Settings (in Toggl Track) -> Data Export -> Export Time Entries. Ask for bonus analyses and plots :)

Addy™ for Power BI Data Analytics
Advisor for Power BI Analytics, aiding in solution planning, design, and construction. Ask Hi or type /help for how to get started.
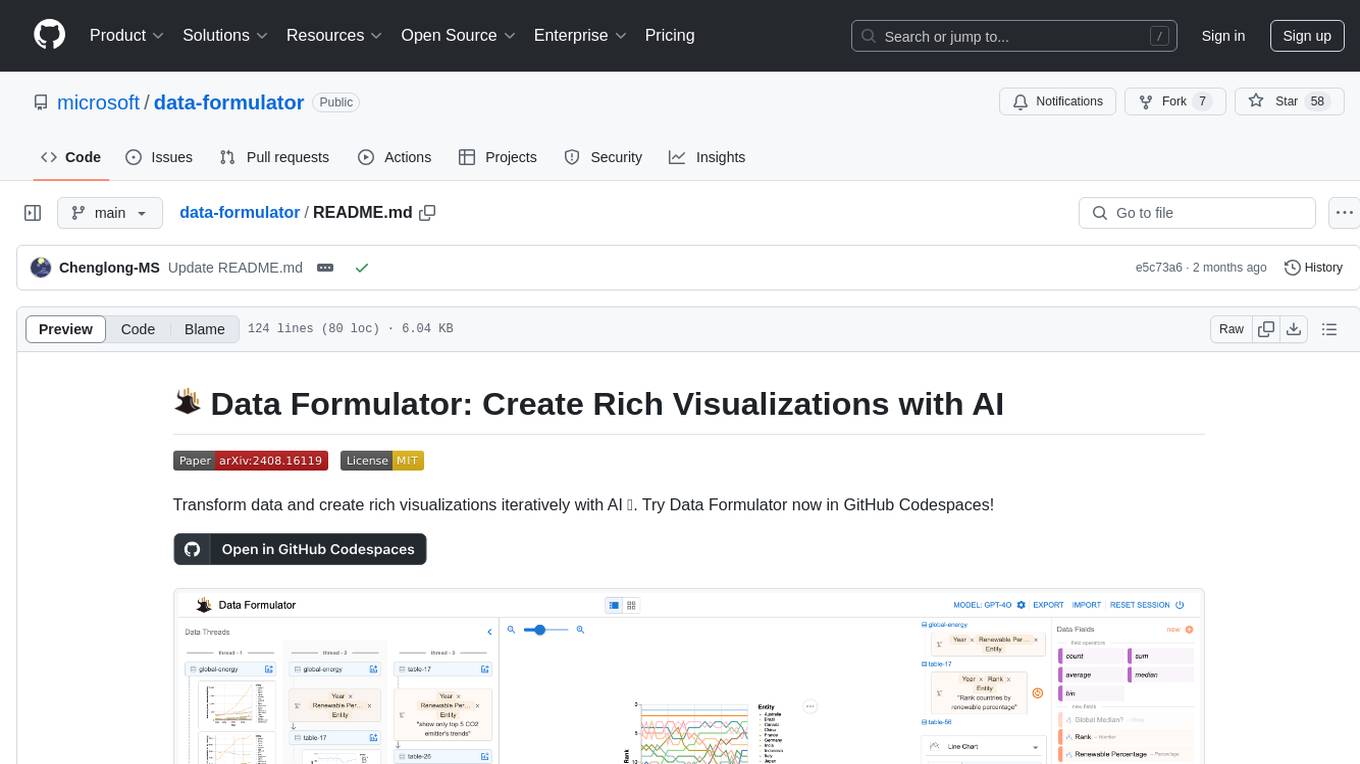
data-formulator
Data Formulator is an AI-powered tool developed by Microsoft Research to help data analysts create rich visualizations iteratively. It combines user interface interactions with natural language inputs to simplify the process of describing chart designs while delegating data transformation to AI. Users can utilize features like blended UI and NL inputs, data threads for history navigation, and code inspection to create impressive visualizations. The tool supports local installation for customization and Codespaces for quick setup. Developers can build new data analysis tools on top of Data Formulator, and research papers are available for further reading.
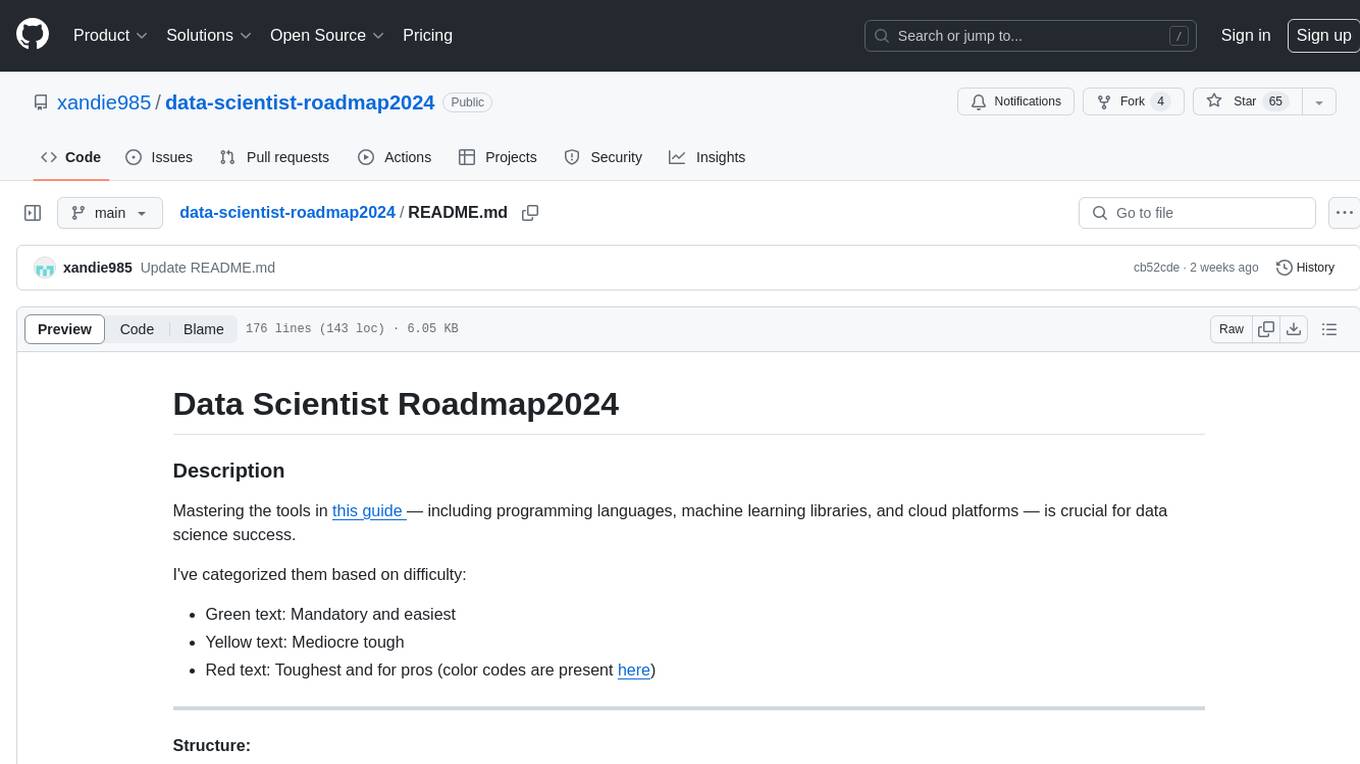
data-scientist-roadmap2024
The Data Scientist Roadmap2024 provides a comprehensive guide to mastering essential tools for data science success. It includes programming languages, machine learning libraries, cloud platforms, and concepts categorized by difficulty. The roadmap covers a wide range of topics from programming languages to machine learning techniques, data visualization tools, and DevOps/MLOps tools. It also includes web development frameworks and specific concepts like supervised and unsupervised learning, NLP, deep learning, reinforcement learning, and statistics. Additionally, it delves into DevOps tools like Airflow and MLFlow, data visualization tools like Tableau and Matplotlib, and other topics such as ETL processes, optimization algorithms, and financial modeling.
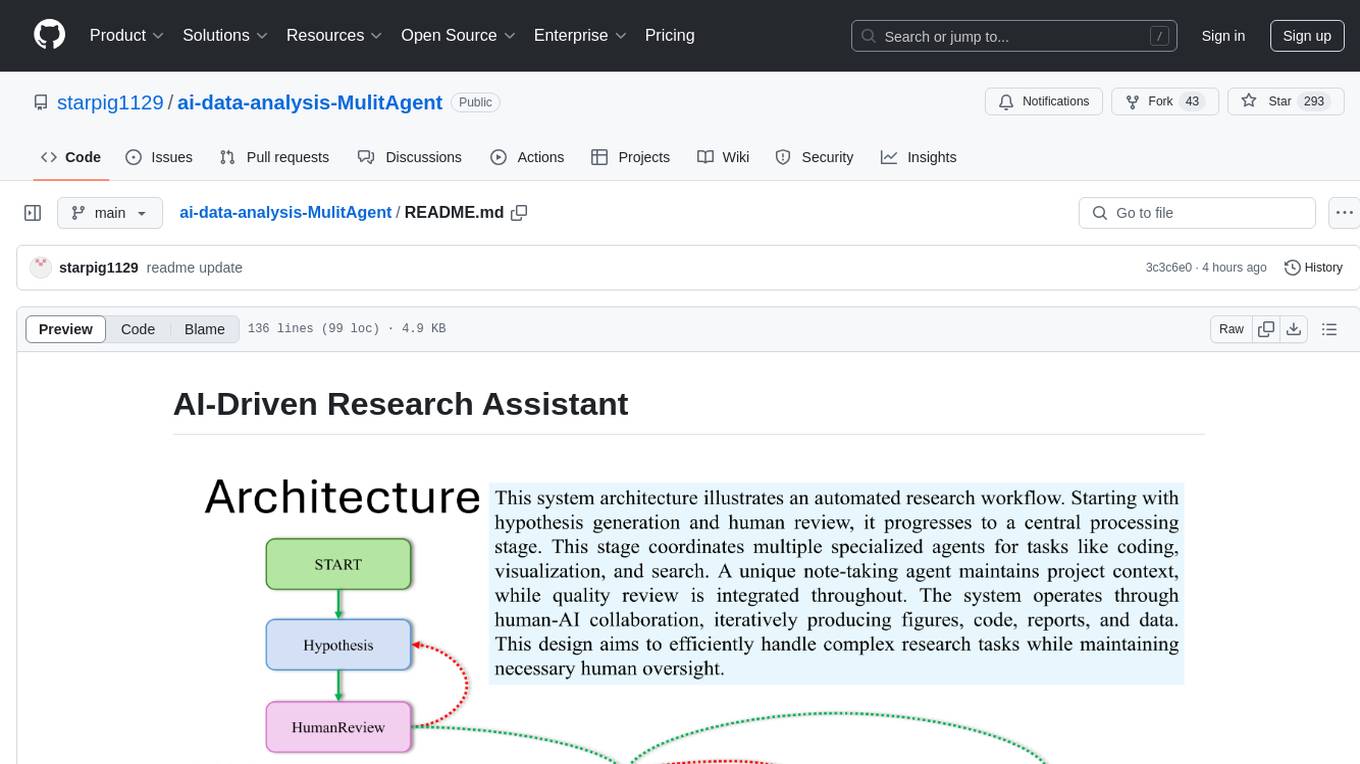
ai-data-analysis-MulitAgent
AI-Driven Research Assistant is an advanced AI-powered system utilizing specialized agents for data analysis, visualization, and report generation. It integrates LangChain, OpenAI's GPT models, and LangGraph for complex research processes. Key features include hypothesis generation, data processing, web search, code generation, and report writing. The system's unique Note Taker agent maintains project state, reducing overhead and improving context retention. System requirements include Python 3.10+ and Jupyter Notebook environment. Installation involves cloning the repository, setting up a Conda virtual environment, installing dependencies, and configuring environment variables. Usage instructions include setting data, running Jupyter Notebook, customizing research tasks, and viewing results. Main components include agents for hypothesis generation, process supervision, visualization, code writing, search, report writing, quality review, and note-taking. Workflow involves hypothesis generation, processing, quality review, and revision. Customization is possible by modifying agent creation and workflow definition. Current issues include OpenAI errors, NoteTaker efficiency, runtime optimization, and refiner improvement. Contributions via pull requests are welcome under the MIT License.
data-juicer
Data-Juicer is a one-stop data processing system to make data higher-quality, juicier, and more digestible for LLMs. It is a systematic & reusable library of 80+ core OPs, 20+ reusable config recipes, and 20+ feature-rich dedicated toolkits, designed to function independently of specific LLM datasets and processing pipelines. Data-Juicer allows detailed data analyses with an automated report generation feature for a deeper understanding of your dataset. Coupled with multi-dimension automatic evaluation capabilities, it supports a timely feedback loop at multiple stages in the LLM development process. Data-Juicer offers tens of pre-built data processing recipes for pre-training, fine-tuning, en, zh, and more scenarios. It provides a speedy data processing pipeline requiring less memory and CPU usage, optimized for maximum productivity. Data-Juicer is flexible & extensible, accommodating most types of data formats and allowing flexible combinations of OPs. It is designed for simplicity, with comprehensive documentation, easy start guides and demo configs, and intuitive configuration with simple adding/removing OPs from existing configs.
data-engineering-zoomcamp
Data Engineering Zoomcamp is a comprehensive course covering various aspects of data engineering, including data ingestion, workflow orchestration, data warehouse, analytics engineering, batch processing, and stream processing. The course provides hands-on experience with tools like Python, Rust, Terraform, Airflow, BigQuery, dbt, PySpark, Kafka, and more. Students will learn how to work with different data technologies to build scalable and efficient data pipelines for analytics and processing. The course is designed for individuals looking to enhance their data engineering skills and gain practical experience in working with big data technologies.

ai-data-science-team
The AI Data Science Team of Copilots is an AI-powered data science team that uses agents to help users perform common data science tasks 10X faster. It includes agents specializing in data cleaning, preparation, feature engineering, modeling, and interpretation of business problems. The project is a work in progress with new data science agents to be released soon. Disclaimer: This project is for educational purposes only and not intended to replace a company's data science team. No warranties or guarantees are provided, and the creator assumes no liability for financial loss.
morph
Morph is a python-centric full-stack framework for building and deploying data apps. It is fast to start, deploy and operate, requires no HTML/CSS knowledge, and is customizable with Python and SQL for advanced data workflows. With Markdown-based syntax and pre-made components, users can create visually appealing designs without writing HTML or CSS.
Data-Science-EBooks
This repository contains a collection of resources in the form of eBooks related to Data Science, Machine Learning, and similar topics.
Ultimate-Data-Science-Toolkit---From-Python-Basics-to-GenerativeAI
Ultimate Data Science Toolkit is a comprehensive repository covering Python basics to Generative AI. It includes modules on Python programming, data analysis, statistics, machine learning, MLOps, case studies, and deep learning. The repository provides detailed tutorials on various topics such as Python data structures, control statements, functions, modules, object-oriented programming, exception handling, file handling, web API, databases, list comprehension, lambda functions, Pandas, Numpy, data visualization, statistical analysis, supervised and unsupervised machine learning algorithms, model serialization, ML pipeline orchestration, case studies, and deep learning concepts like neural networks and autoencoders.
VMind
VMind is an open-source solution for intelligent visualization, providing an intelligent chart component based on LLM by VisActor. It allows users to create chart narrative works with natural language interaction, edit charts through dialogue, and export narratives as videos or GIFs. The tool is easy to use, scalable, supports various chart types, and offers one-click export functionality. Users can customize chart styles, specify themes, and aggregate data using LLM models. VMind aims to enhance efficiency in creating data visualization works through dialogue-based editing and natural language interaction.
Smart-Connections-Visualizer
The Smart Connections Visualizer Plugin is a tool designed to enhance note-taking and information visualization by creating dynamic force-directed graphs that represent connections between notes or excerpts. Users can customize visualization settings, preview notes, and interact with the graph to explore relationships and insights within their notes. The plugin aims to revolutionize communication with AI and improve decision-making processes by visualizing complex information in a more intuitive and context-driven manner.
vizra-adk
Vizra-ADK is a data visualization tool that allows users to create interactive and customizable visualizations for their data. With a user-friendly interface and a wide range of customization options, Vizra-ADK makes it easy for users to explore and analyze their data in a visually appealing way. Whether you're a data scientist looking to create informative charts and graphs, or a business analyst wanting to present your findings in a compelling way, Vizra-ADK has you covered. The tool supports various data formats and provides features like filtering, sorting, and grouping to help users make sense of their data quickly and efficiently.
aitviewer
A set of tools to visualize and interact with sequences of 3D data with cross-platform support on Windows, Linux, and macOS. It provides a native Python interface for loading and displaying SMPL[-H/-X], MANO, FLAME, STAR, and SUPR sequences in an interactive viewer. Users can render 3D data on top of images, edit SMPL sequences and poses, export screenshots and videos, and utilize a high-performance ModernGL-based rendering pipeline. The tool is designed for easy use and hacking, with features like headless mode, remote mode, animatable camera paths, and a built-in extensible GUI.
aura-design
Aura Design is an open-source AI-friendly component library for next-generation intelligent applications. It offers AI-optimized interactive components designed for seamless integration with AI model I/O. The library works with various web frameworks and allows easy customization to suit specific requirements. With a modern design and smart markdown renderer, Aura Design enhances the overall user experience.
dataline
DataLine is an AI-driven data analysis and visualization tool designed for technical and non-technical users to explore data quickly. It offers privacy-focused data storage on the user's device, supports various data sources, generates charts, executes queries, and facilitates report building. The tool aims to speed up data analysis tasks for businesses and individuals by providing a user-friendly interface and natural language querying capabilities.
preswald
Preswald is a full-stack platform for building, deploying, and managing interactive data applications in Python. It simplifies the process by combining ingestion, storage, transformation, and visualization into one lightweight SDK. With Preswald, users can connect to various data sources, customize app themes, and easily deploy apps locally. The platform focuses on code-first simplicity, end-to-end coverage, and efficiency by design, making it suitable for prototyping internal tools or deploying production-grade apps with reduced complexity and cost.
cia
CIA is a powerful open-source tool designed for data analysis and visualization. It provides a user-friendly interface for processing large datasets and generating insightful reports. With CIA, users can easily explore data, perform statistical analysis, and create interactive visualizations to communicate findings effectively. Whether you are a data scientist, analyst, or researcher, CIA offers a comprehensive set of features to streamline your data analysis workflow and uncover valuable insights.
ST-Raptor
ST-Raptor is a powerful open-source tool for analyzing and visualizing spatial-temporal data. It provides a user-friendly interface for exploring complex datasets and generating insightful visualizations. With ST-Raptor, users can easily identify patterns, trends, and anomalies in their spatial-temporal data, making it ideal for researchers, analysts, and data scientists working with geospatial and time-series data.
AirCasting
AirCasting is a platform for gathering, visualizing, and sharing environmental data. It aims to provide a central hub for environmental data, making it easier for people to access and use this information to make informed decisions about their environment.